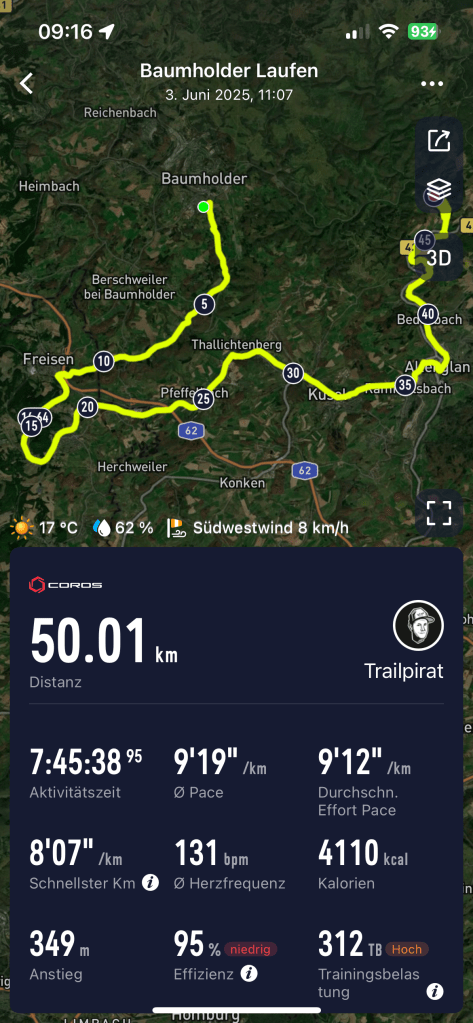
Yesterday, I completed my final long run (well, more of a hike to be honest) before the big event — and it went great! The route was 50 kilometers long, and even though my legs started to feel heavy toward the end, that’s pretty normal for this kind of distance.
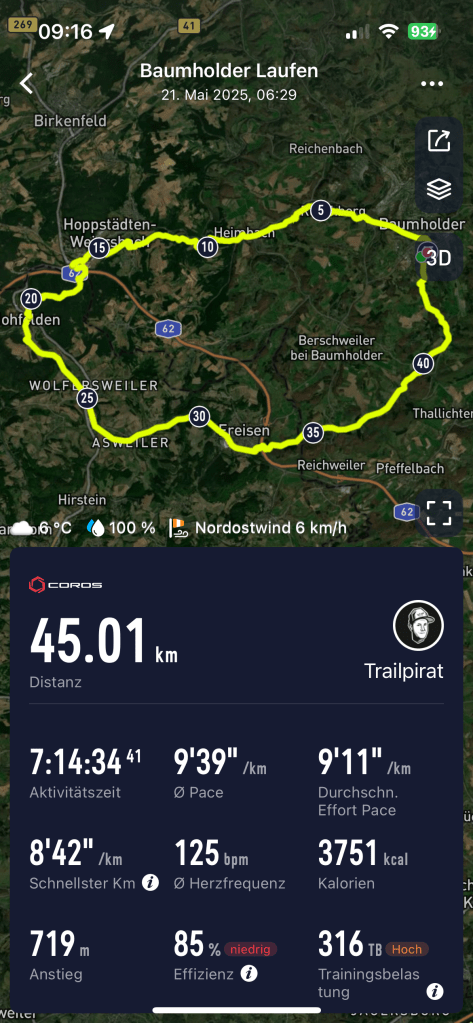
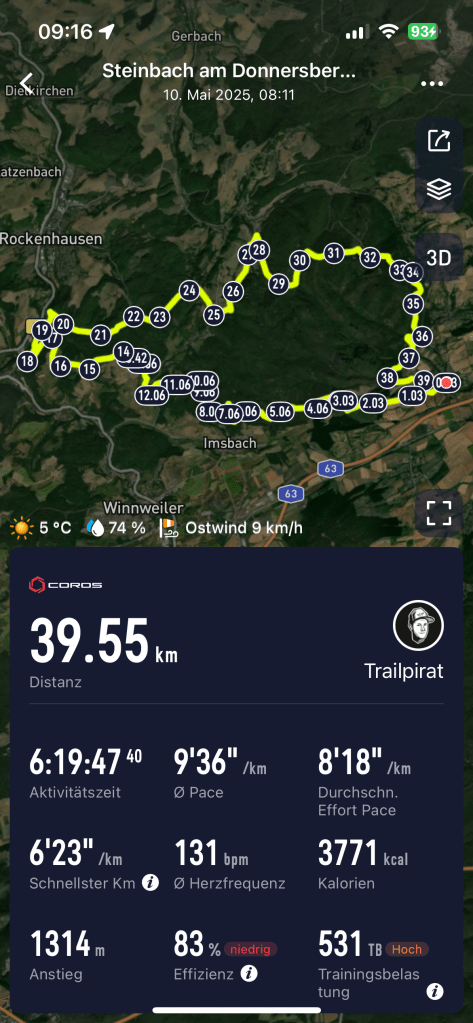
Looking back at the past few months, I’ve put in some solid training. If you scroll through the photos, you’ll see all of my long runs and hikes so far this year. They weren’t easy — with different terrains, weather conditions, and lots of elevation — but I feel like I’ve built a strong foundation.
That’s why I’m feeling confident and well-prepared for the “24h von Rheinland-Pfalz” on July 21, 2025 here in Germany. It’s going to be a huge challenge, but I’m ready to take it on!
With two successful 30K+ long hikes completed, I’ve built a solid foundation for my preparation for the 24-hour event. My body is already adapting: while the first 33K long hike left my legs feeling heavy, the second 30K hike felt noticeably better. But what do the numbers say about my performance?
Detailed Data Analysis: Progress Between the Two Long Hikes
1. Overall Comparison
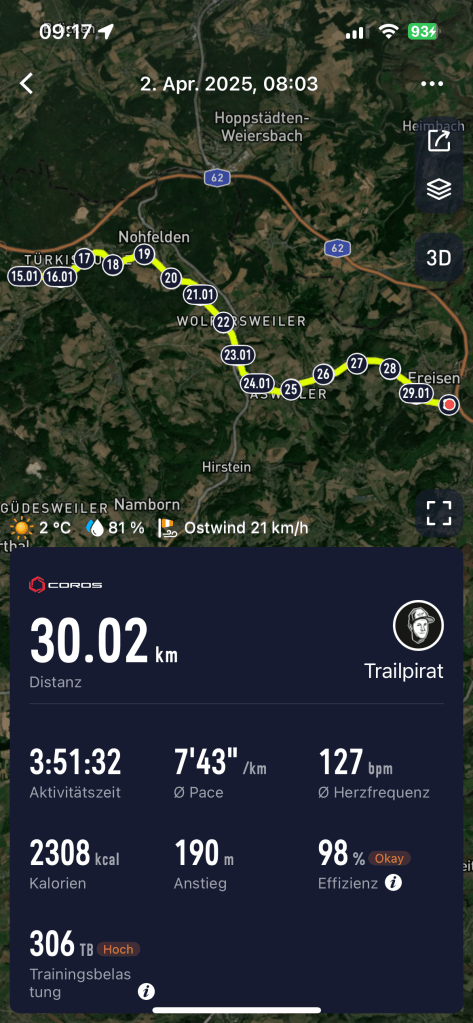
Long Hike 1 (33.67 km)
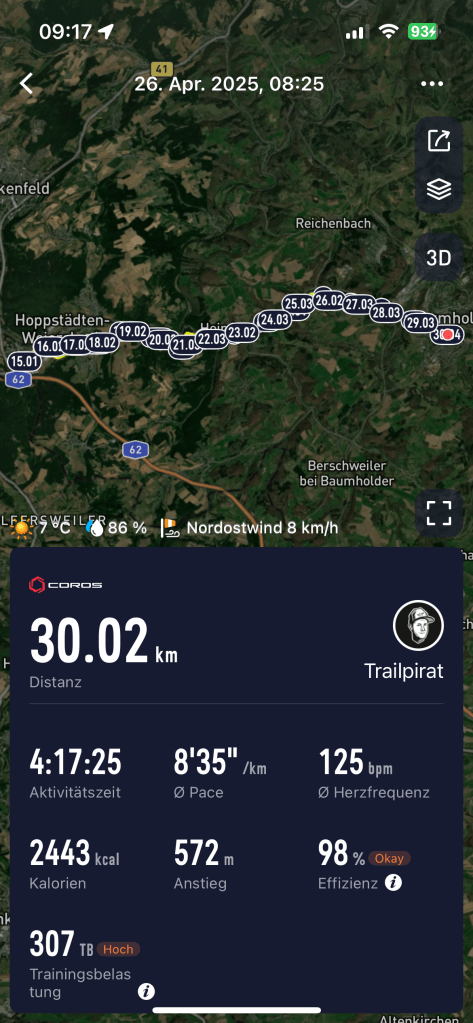
Long Hike 2 (30.02 km)
Change
Duration
4:27:49 h
3:51:32 h
-36 min
Pace
7:57 min/km
7:43 min/km
Faster
Heart Rate (Avg.)
136 bpm
127 bpm
-9 bpm
Elevation Gain
517 m
306 m
-211 m
Calories Burned
2675 kcal
2308 kcal
-367 kcal
➡ Key takeaway:
Despite running at a faster pace, my average heart rate in the second long hike was 9 bpm lower, indicating that my body is becoming more efficient. I also felt less fatigued—a great sign of adaptation.
2. Training Efficiency: How Well Did I Manage My Effort?
Heart Rate Zones
Zone
Long Hike 1 (33K)
Long Hike 2 (30K)
Zone 1 (<131 bpm, Recovery)
27% (1:12 h)
47% (1:48 h)
Zone 2 (131-147 bpm, Endurance)
69% (3:10 h)
49% (1:54 h)
Zone 3 (147-166 bpm, Moderate Effort)
4% (0:10 h)
4% (0:09 h)
➡ Key takeaway:
In my first long hike, I spent more time in Zone 2, meaning my body had to work harder.
In the second long hike, I spent more time in Zone 1, which suggests my endurance has improved.
Conclusion: My cardiovascular system is becoming more efficient, allowing me to sustain long efforts with a lower heart rate.
3. Stride Dynamics & Running Economy
Long Hike 1 (33K)
Long Hike 2 (30K)
Change
Cadence (steps/min)
132
128
-4
Stride Height (cm)
10.4 cm
9.8 cm
-0.6 cm
Ground Contact Time (ms)
348 ms
361 ms
+13 ms
Power Output (W)
191 W
190 W
Stable
➡ Key takeaway:
Slight decrease in cadence: Indicates a more controlled, less rushed movement—possibly due to improved pacing.
Slight decrease in stride height: Suggests a more energy-efficient movement with less unnecessary vertical motion.
Slight increase in ground contact time: Could mean a more relaxed stride as my body adapts to long efforts.
What does this mean?
My movement is becoming smoother and more economical, reducing energy loss and making long efforts feel easier.
4. Energy Expenditure & Nutrition
First long hike (33K): 2675 kcal burned
Second long hike (30K): 2308 kcal burned
➡ Key takeaway: My energy expenditure was higher in the first hike due to the longer distance and higher heart rate.
Since I consumed three energy gels per hike (each with 30g of carbs, totaling 90g per session), I might experiment with slightly increasing my intake (e.g., 120g of carbs) to see if it further improves my endurance.
Conclusion & Key Takeaways for Future Long Hikes
✔ My body is adapting: The lower heart rate and better recovery after the second hike indicate improved endurance.
✔ My movement is becoming more efficient: I am hiking more smoothly with less unnecessary energy loss.
✔ My energy management is on track: My fueling strategy worked well, but I may slightly increase carb intake to test its effects.
➡ Next steps:
🔹 Keep incorporating long hikes to continue the adaptation process
🔹 Introduce more trail sections to improve technical hiking skills
🔹 Experiment with slightly higher carbohydrate intake to optimize performance
With these insights, I can refine my training strategy and tackle my next 30K+ hike with even more confidence!
• “Five loops. 100 miles. 60,000 feet of elevation gain. Less than 20 finishers in almost 40 years. The Barkley Marathons is not just a race – it’s a legend.”
• Why this race is so fascinating
2. The Origins: An Ultra Race Born as a Joke
• Lazarus Lake (Gary Cantrell) and his idea
• How the 1977 prison escape of James Earl Ray from Brushy Mountain State Prison inspired him
• “If a convicted felon could only manage 8 miles in 55 hours, then an ultrarunner would find a real challenge here.”
• The first race in 1986, with only a handful of participants
3. The Rules: Absurd, Brutal, and Mysterious
• The Course
• 5 loops of roughly 20 miles each through Frozen Head State Park
• Constant elevation changes, barely any marked trails
• The Application Process (The Big Secret)
• No official website
• Runners must find Lazarus Lake’s email and submit a compelling application
• New runners pay a $1.60 entry fee and are often required to bring a license plate from their home country
• The Books as Checkpoints
• At secret locations along the course, runners must tear out pages from books to prove they followed the correct route
4. The Evolution: From Insider Secret to Global Legend
• How it gained attention
• For years, it remained a niche race for die-hard ultrarunners
• The 2014 documentary “The Race That Eats Its Young” made Barkley famous worldwide
• A Netflix documentary in 2024 sparked a new wave of interest
• Fewer than 20 finishers in the race’s history
5. Why Has the Barkley Marathons Become a Cult Race?
• The mystery around the application process
• The insane difficulty level – even elite ultrarunners fail
• The traditions & inside jokes
• The “Taps” song played for those who fail
• The famous “Yellow Gate” as the start and finish line
6. Conclusion: A Race for Legends
• Why the Barkley Marathons remains one of a kind
• How it differs from other ultra races
• Open question to readers: “Would you dare to apply?”